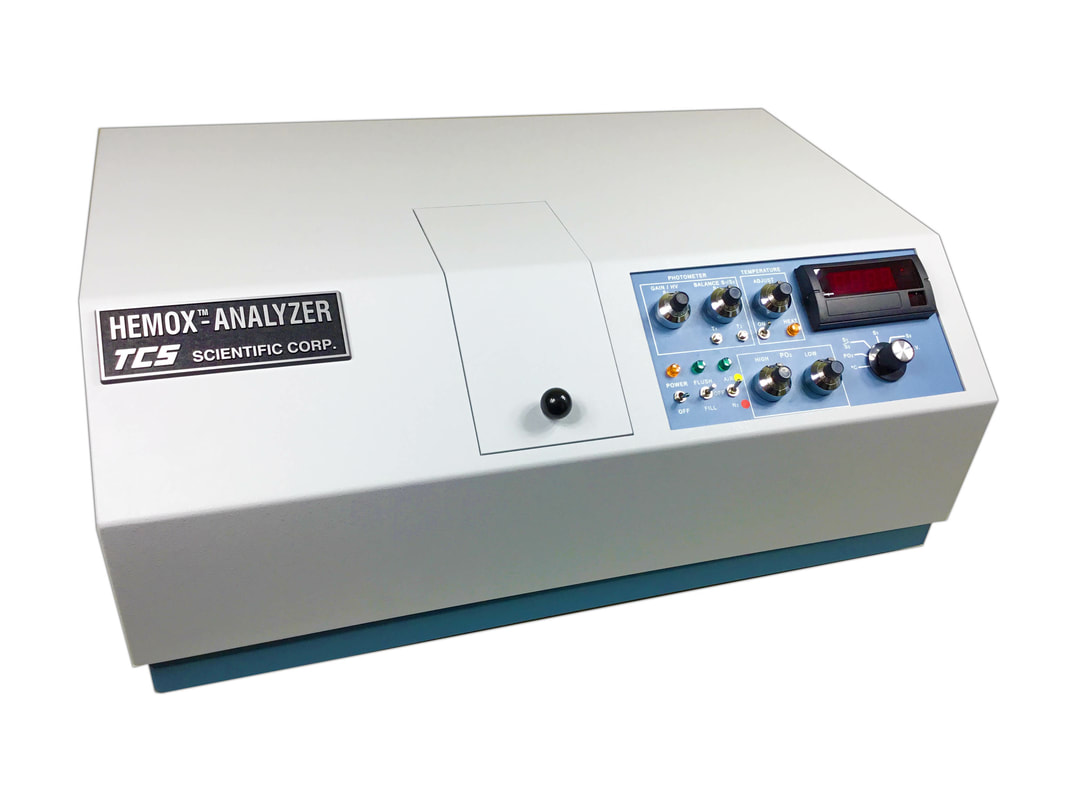
TCS Hemox
Analyzer Evaluation
The following evaluation of the Hemox Analyzer was
independently conducted by Roberta Guarnone, Esther
Centenara and Giovanni Barosi. The results of the
evaluation were published in a short report in
Haematologica. 1995; 80: Sept.-Oct.(5) 426-430
PERFORMANCE CHARACTERISTICS OF HEMOX-ANALYZER FOR
ASSESSMENT OF THE HEMOGLOBIN DISSOCIATION CURVE
Roberta Guarnone*, Esther Centenara*, Giovanni Barosi°
*Istituto di Medicina Interna e Oncologia Medica,
°Laboratorio di Informauca Medica, IRCCS Policlinico S.
Matteo, Pavia, Italy
Abstract
The Hemox-Analyzer (TCS, Medical Products Division,
Southampton. PA) is an automatic system for determining the
oxyhemoglobin dissociation curve (ODC) and P50 values. The
ODC is recorded during deoxygenation with nitrogen gas and
plotted on graph paper; the oxygen tension is detected by a
Clarke electrode while the oxyhemoglobin fraction (%HbO2)
is evaluated by a dual-wavelength spectrophotometer. Even
though this instrument has been commercially available for
more than 20 years, its performance characteristics have
never been assessed. We evaluated the performance
characteristics of the Hemox-Analyzer. P50 was tested in 28
healthy volunteers, in 16 anemic and in 9 polycythemic
patients. To test its precision we evaluated both inter-
and intra-assay variability. The system shows good
precision: standard deviation was 0.39 for assays in
duplicate, CV=1 .9% for intra-assay measurements and CV3.O%
for inter-assay. The mean P50 values were 25.3±1.5 mmHg in
normal volunteers and 27.3±1.4 mmHg in anemic patients. The
Hemox-Analyzer is a simple, quick and reliable instrument
for recording the oxyhemoglobin dissociation curve. Both
the P50 value and observation of the fine structure of the
curve can furnish information about the delivery of oxygen
to tissues.
The oxyhemoglobin dissociation curve (ODC) for whole blood
relates hemoglobin percentage saturation with oxygen to the
partial pressure of the oxygen with which the blood is in
contact. It describes how oxygen binds to hemoglobin and
how it is released, as can be imagined in the lungs and
capillaries, respectively. The ODC has a sigmoidal shape
and is characterized by the P50 value, i.e. the partial
pressure of oxygen at which hemoglobin is 50% saturated
with oxygen. The primary reason for an abnormal ODC
position is the presence of pathologic hemoglobins with
altered oxygen affinity, but modifications are also caused
by disease states which affect the factors that displace
the curve, mainly pH, temperature, 2,3-DPG and pCO21
Moreover, P50 is a useful parameter for studying the
regulation of erythropoiesis in different pathological and
experimental conditia,s.2.3 Thus the performance
characteristics of the Instruments employed and the
reliability of the measurements obtained are important for
both diagnostic accuracy and research results.
For routine P50 measurements laboratories are usually
equipped with a blood gas analyzer and a tonometer for the
determination of pO2, pCO2, pH and sO2. P50 is then
calculated through different algorithms that interrelate
these parameters.4 In recent years new machines that
combine a multi-wavelength blood oxymeter and a blood gas
analyzer have became available. These instruments
automatically provide in vitro determination of the oxygen
status of blood and P50.5
The Hemox-Analyzer (TCS, Medical Products Division,
Southampton, PA) is an apparatus that determines oxygen
partial pressure and degree of hemoglobin saturation with
oxygen by means of a Clark oxygen electrode and
spectrophotometry, respectively. White this device has been
commercially available for more than 20 years. its
performance characteristics have never been examined.
In the present study we evaluate the characteristics of the
measurements provided by the Hemox-Analyzer and report
preliminary data obtained in a series of patients with
various types of anemia in order to evaluate the
sensitivity with which the instrument records changes In
P50 at different Hb levels.
MATERIALS & METHODS
P50 Measurement
The Hemox-Analyzer determines the ODC by exposing 50 µ L of
blood or hemolysate to an increasing partial pressure of
oxygen and deoxygenating it with nitrogen gas. A Clark
oxygen electrode detects the change in oxygen tension,
which is recorded on the x-axis of an x-y recorder. The
resulting Increase in oxyhemoglobin fraction is
simultaneously monitored by dual-wavelength
spectrophotometry at 560 nm and 576 nm and displayed on the
y-axis.
For all the experiments, blood samples were taken from the
antemedial vein, anticoagulated with heparin and kept at
4°C on wet ice until the assay. Fifty µ L of whole blood
were diluted in 5 µ L of Hemox-solution, a
manufacturer-provided buffer that keeps the pH of the
solution at a value of 7.4±0.01. The sample-buffer is drawn
into a cuvette and the temperature of the mixture is
equilibrated and brought to 37°C; the sample is then
oxygenated to 100% with air. After adjustment of the pO2
value the sample is deoxygenated with nitrogen; durIng the
deoxygenation process the curve is recorded on graph paper.
The P50 value is extrapolated on the x-axis as the point at
which 02 saturation is 50%. The time requires for a
complete recording is approximately 30 minutes.
Intra- and Inter-assay Variations
For intra-assay variation determination, 35 blood samples
drawn from normal subjects (12 samples) and patients with
anemia (23 samples) were tested in duplicate. For
inter-assay variability determination, two subjects were
tested one day apart for 4 days at the same hour. The same
lot of diluent and buffer was used for both intra- and
inter-assay variability.
Stability of the Sample
The manufacturer s instructions suggest determining the ODC
as soon as possible after blood has been drawn. In
practice, it is sometimes convenient or necessary to
postpone the assay. Thus, we recorded the variations in the
measurement results after allowing the samples to remain at
different temperatures for varying periods of time.
Samples were collected at 8 a.m. from a normal male subject
and from a patient with iron deficiency anemia (Hb=10
gIdL). Aliquots of each sample were divided into twelve
tubes and six were maintained at room temperature and six
on ice. The determinations were carried out immediately
after blood was drawn and after 1, 2, 5,12 and 24 hours.
Subjects
P50 was evaluated in 28 healthy volunteers, 14 males and 14
females, aged from 20 to 35 years. Sixteen patients with
anemia and 9 with erythrocytosis due to myeloproliferative
disease were also tested. The anemic patients represented a
group of consecutive patients with Hb lower than 12 g/dL
who were admitted to our Clinic from December 1993 to March
1994. Five presented hypochromic microcytic anemia
secondary to chronic hemorrhage, 4 anemia of chronic
desease, 2 anemia of chronic renal failure and 5 showed
anemia consequent to hematologic malignancies. Hemoglobin
and other red cell indices were measured with an automatic
Coulter-S counter.
Statistical Analysis
Statistical analysis was performed with MICROSTAT (Ecosoft,
Inc.) on an IBM-PC. The Students' t-test was used for
comparisons between means. Pearson's test to calculate
correlation coefficients and linear regression analysis to
assess the correlation between variables. A p value less
than 0.05 was considered significant.
RESULTS
Performance Charecteristics
In the 35 samples tested in duplicate (intraassay
variability), P50 ranged from 15 to 29.2 mmHg. Standard
deviation of the duplicate assays was 0.39, which
represents a 1.9 percent coefficient of variation (Table
1). The standard deviation of the duplicate values was not
correlated with the P50 or Hb level of the patient assayed.
The inter-assay variability study yielded P50 values
ranging from 28 to 29.6 mmHg, with a median value of 28.5
mmHg, a SD of 0.88 and a coefficient of variation of 3%.
When the samples were allowed to remain at room temperature
or on ice, a decline in the P50 value was observed in both
conditions. When samples from normal subjects were tested,
P50 decreased from a basal value of 28 mmHg to 27.4 mmHg at
the 5th hour and to 26.9 at the 24th hour on ice, and from
28 mmHg to 25.7 mmHg at the 5th hour and to 22.5 mmHg at
the 24th hour at room temperature. These values represent a
respective decrease of 2.1% at the 5th hour and 3.9% at the
24th hour for samples stored on ice, and a respective
decrease of 8.2% at the 5th hour and 19.6% at the 24th hour
for samples kept at room temperature.
For the anemic patient the decline was from 29.5 mmHg to
28.8 mmHg at the 5th hour and to 27 mmHg at the 24th In the
samples on ice (a decrease of 2.3% at the 5th and 8.4% at
the 24th hour), and from 30 to 27 mmHg at the 5th hour and
to 25 mmHg at the 24th hour in those at room temperature (a
decrease of 10% at the 5th and 16.6% at the 24th hour).
Study Populations
The range of P50 values for normal subjects was 23-28.5
(mean 25.3±1.5) mmHg. There was no significant difference
between males and females in spite of the significantly
lower hemoglobin levels in the latter (a mean of 15.4 g/dL,
range 14.3-16.8, versus a mean of 13.4 gIdL, range
12.6-15.2).
Anemic patients showed hemoglobin values ranging from 3.5
to 10.5 g/dL. The mean P50 value in the anemic population
was 27.3 mmHg (range 23 to 32 mmHg) and was significantly
higher than in normal subjects (p<0.01).
Patients with erythrocytosis showed normal P50 values
(median 25.4, range from 23.6 to 29.5 mmHg) (Table 2).
The correlation between Hb and P50 did not reach
statistical significance in either the normal subjects or
the anemic ones. On the contrary significant inverse
correlation was demonstrated between the two parameters
when the two populations were considered together (r =
-0.5; p < 0.01) (Figure 1).
Discussion
Changes in hemoglobin oxygen affinity may play an important
role in determining the amount of oxygen released from
arterial blood. Following the work by Drabkan6 on the
optical properties of hemoglobin and its derivatives,
methods based on light absorption were developed that
allowed exact determination of the ODC with an automatic
apparatus. The Hemox-Analyzer is one such device for
recording the ODC. The operating time required for the
determination is about 30 minutes; the first curve of the
day takes more time because it is necessary to first test
the functionality of the oxygen membrane. This time is very
similar to that reported for other instruments based on
spectrophotometry, such as the Hemo-scan (30-40 minutes),
while manual or automated methods such as the CO-Oximeter
take much more time (from 100 to 120 minutes).4,5,7,8 Since
it is well known that a number of factors, e.g. temperature
and pH may influence the results and since one application
of the instrument involves sequence measurements of samples
for experimental purposes, we decided to test some
performance characteristics that had never been assessed
before.
The range of P50 values for normal subjects was 23-28.5
mmHg, similar to that reported for instruments based on a
spectrophotometric methods and slightly lower than that
reported by authors who utilized different techniques.9,10
P50 values obtained with the Hemox-Analyzer were found to
be extremely reproducible in both intra- and inter-assays.
The respective coefficients of variation were 1.9 and 3%.
Regarding intra-assay variation, the literature reports SD
values for duplicate experiments of 1.87 mmHg for the
manual method, 0.94 mmHg for the CO-Oximeter, 0.78 mmHg for
the Hemoscan7’9 the Hemox-Analyzer with a SD=0.39 mmHg
shows good reproducibility.
It is also well known that P50 decreases with time due to
increased formation of methemoglobin and a decline in
2,3-DPG content, so the manufacturer recommends testing the
sample immediately after blood collection. Given the
practical consideration that some samples are not
immediately available after blood collection, we also
tested the stability of samples maintained both on ice and
at room temperature. The best reproducibility was obtained
with samples stored on wet ice and tested the day of
collection; in fact, the curve shifts to the left in
samples stored for more than 24 hours (even if maintained
on ice), while samples kept at room temperature show a
notable shift of the ODC to the left a few hours after
blood collection. However, sample stability proved to be
fairly good up to the 5th hour since the variation in p50
during this period is in the range of the intra-assay
variability.
Our study also evaluated the reliability of the
measurements by assessing how anemia influences P50. It is
known that there is a physiological adaptation to
anemia-induced hypoxia which is mediated by increases in
2,3-DPG. Samples from anemic patients showed P50 values
that were significantly higher than those from normal
subjects, and a correlation was observed between hemoglobin
and P50 when normal subjects and anemic patients were
considered together.
There was an even greater variability in pSO values In the
anemic group, suggesting that different adaptive mechanisms
take place in the red cell when hemoglobin levels fall.
Such mechanisms are partly independent of hemoglobin levels
and differ in the various forms of anemia.
In conclusion, the main advantages of the Hemox-Analyzer
system are the stability of the measurements and the
reproducibility of the results. Our apparatus seems to
represent a good system for recording the ODC, and our data
coincide well with those of other investigators who
utilized spectrophotometric methods under the same
conditions.
References
1. Thomas HM, Lefrak SS, Irwin RS, Fritts HW, Caldwell PRB.
The oxyhemoglobin dissociation curve in health and disease.
Ami Med 1914: 57:331-44.
2. Barosi G. Control of erythropoietin production in man.
Haematologica 1993; 78:77-9.
3. Eridani S. Polycythemia: from clones to clinic.
Haematologica 1993; 78:345-52.
4. Siggaard-Antiersan O, Wimberley N, Fogh-Andersen N.
Gothgen IH. Measured and derived quantities with modern pH
and blood gas equipment: calculation algorithms with 54
equations. Scand J Clin Lab Invest 1988; 48(Suppl 189):
7-15.
5. Zwart A, Buursma A, Zijlstre WG. A new trend in blood
gas chemistry the measurement of clinically relevant
hemoglobin derivatives. Performance of the OSM3
hemoximeter. Scanti J Clin Lab Invest 1987; 47(Suppl
188):57-60.
6. Drabkin DL Spectroscopy, photometry and
spectrophotometry. In: Glaser P. ed. Medical physics, vol.
11. Chicago: Year Book Publishing Co., 1950: 1039-88.
7. Asakura T, Reilly MP. Methods for the measurement of
oxygen equilibrium curves of red cell suspensions and
hemoglobin solutions. In: Nicolau C. ed. Oxygen transport
in red blood cells. New York Pergamon Press, 1985:57-75.
8. Wimberley PD. Burnett RW, Covington AK et al. Guidelines
for routine measurement of blood hemoglobin oxygen
affinity. Scand J Clin Lab Invest 1990; (Suppl 203);
227-34.
9. Nelson MG. Savage GA, Cooke PJ, Lappin TRJ.
Determination of the oxygen dissociation curve end P50 of
whole blood. Am J Clin Pathol 1981; 75:395-9.
10. Imai K, Morimoto H, Kotani M, et al. Studies on the
function of abnormal hemoglobins, I. An improved method for
automatic measurement of the oxygen equilibrium curve of
hemoglobin. Biochim Biophys Acta 1970; 200:189-96.
Correspondence: Giovanni Barosi, M.D., Laboratori di
Informatica Medica, IRCCS Policlinico S. Matteo. 27100
Pavia, Italy.
Acknowledgments; this work was supported by a grant from
IRCCS Policlinico S. Matteo. Pavia.
Received May 15. 1995; accepted July 26, 1995.